iA Writer
The Original Focused Writing App
Charts tell a story better when they stay simple. Presenter’s charts are focused, with quiet colors and readable layouts. Create tables and charts directly in the Markdown Editor. No third-party tools. No copy-paste.
Markdown tables are easier to read than HTML, but still a weak spot: they’re tedious to type by hand. Presenter renders them cleanly in the Editor and in Presentation Mode:
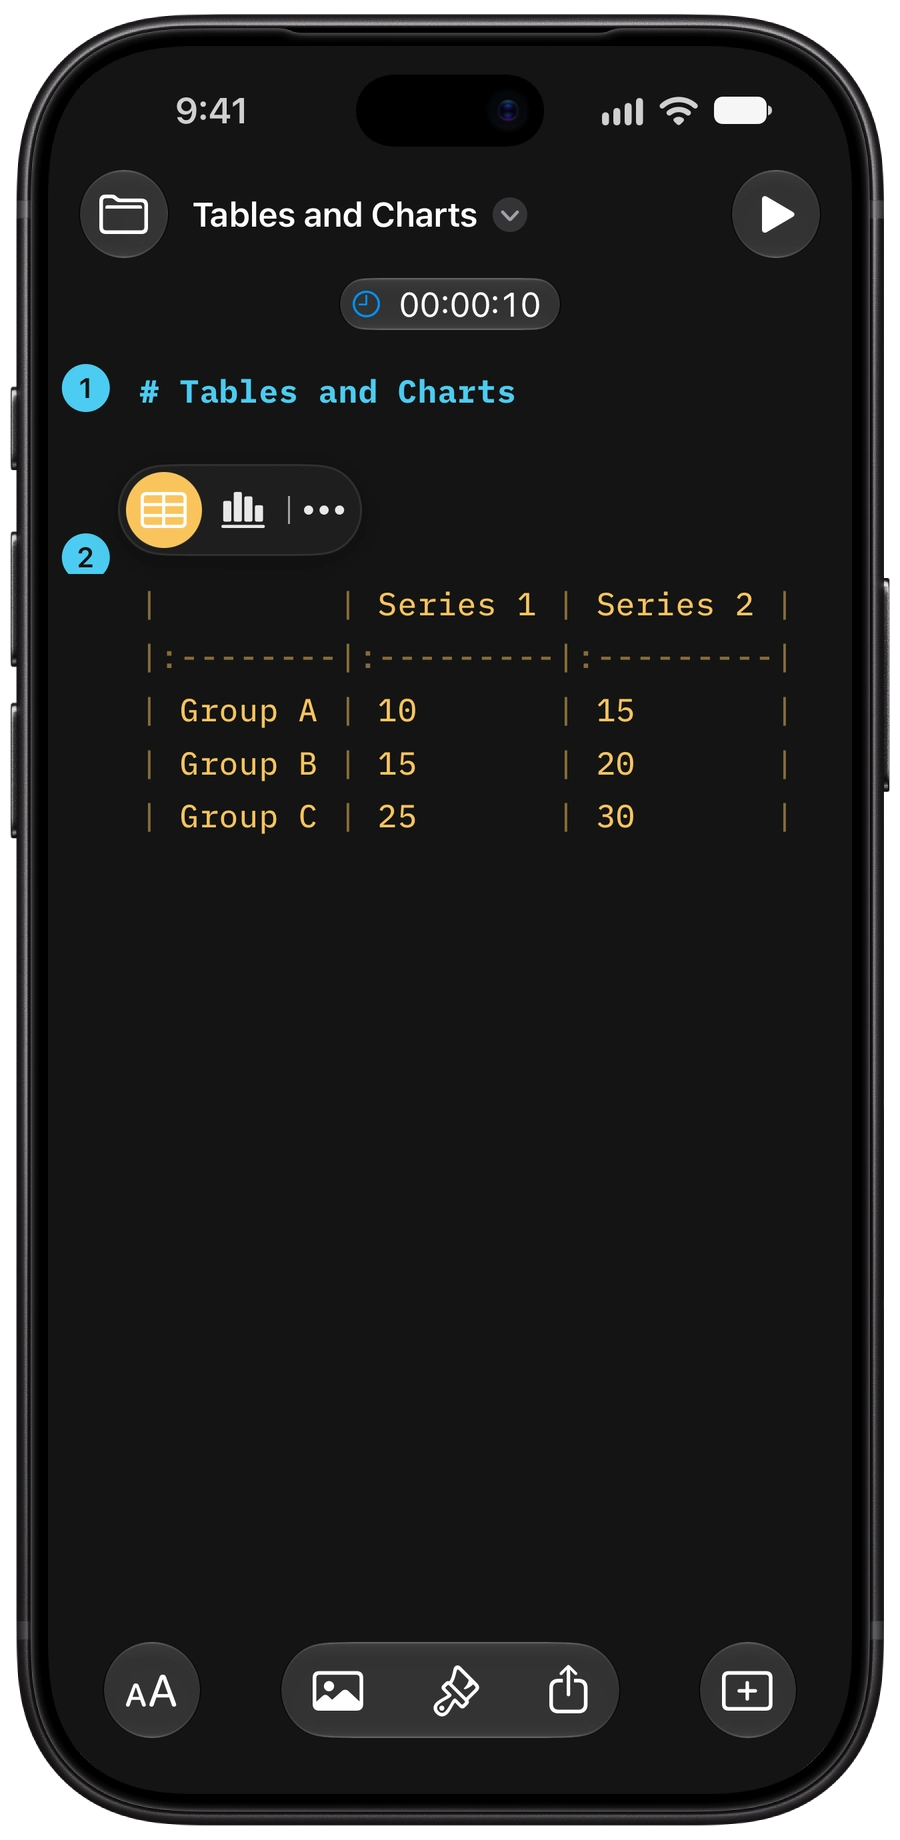
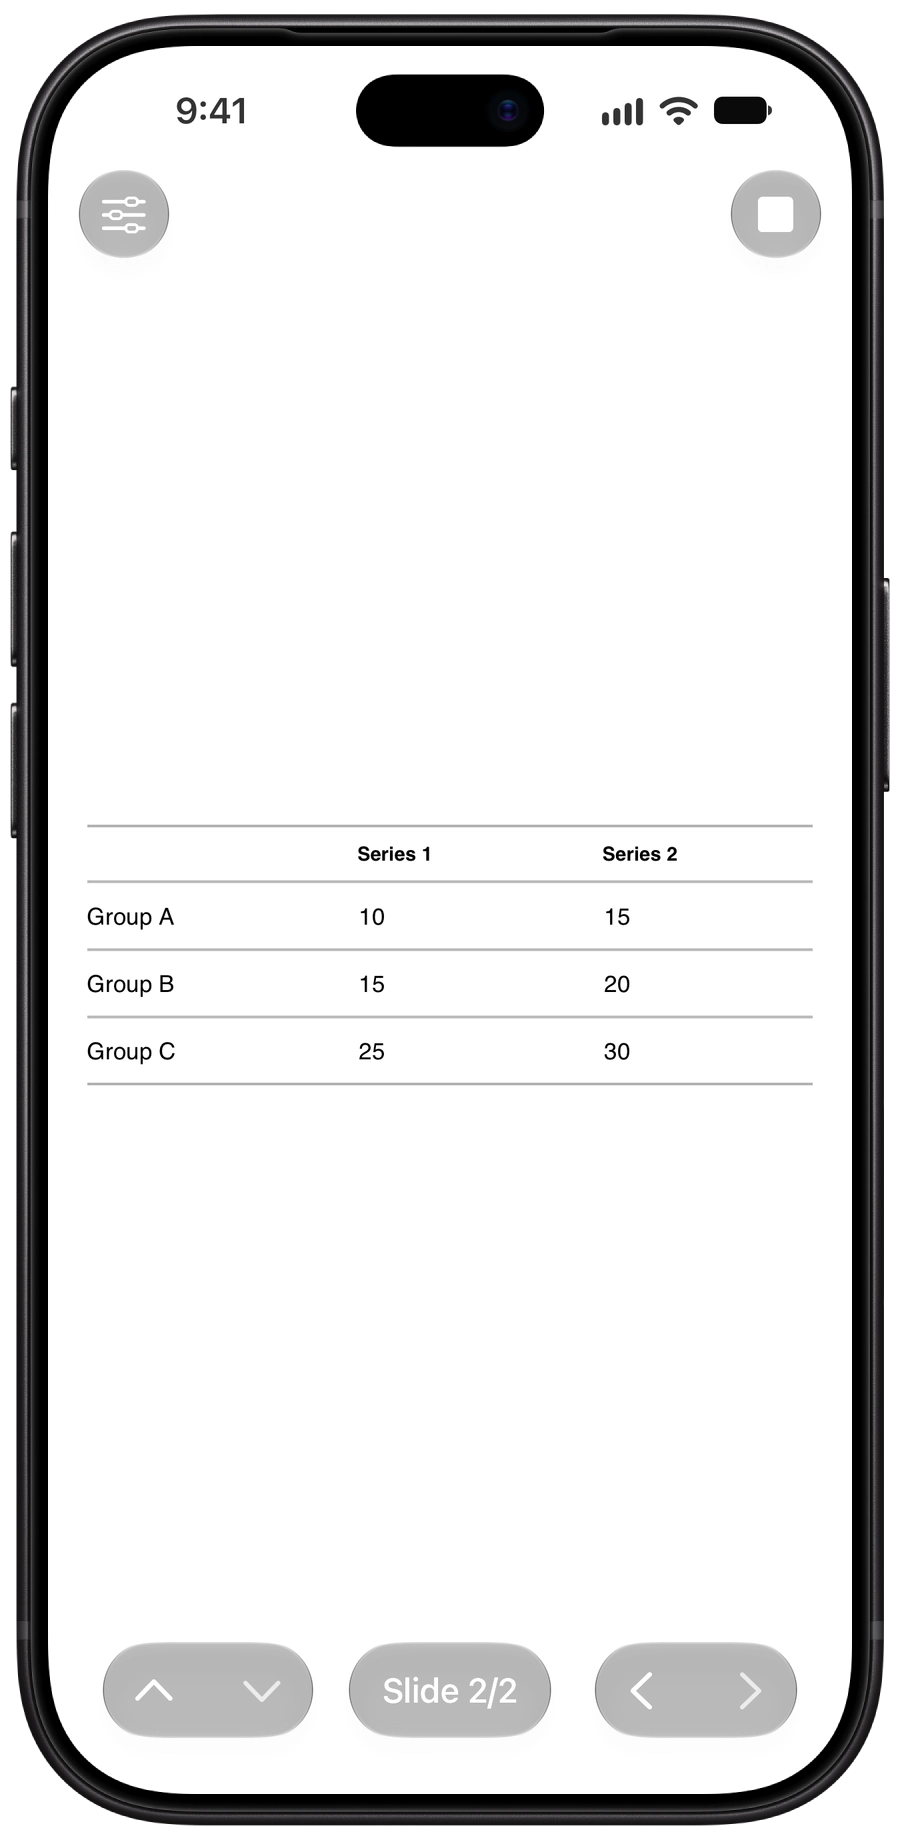
That’s why iA Presenter includes a built-in table generator. Open the Command Palette from the keyboard bar and search for Table & Charts. To choose which commands the palette lists, go to Settings → Commands.
You can import an existing CSV if your data is ready. For larger datasets, use native CSV blocks. This keeps complex data manageable.
You can also copy-paste a table from your browser. It will paste it directly in Markdown in the Editor.
To edit a table, click inside it. A contextual toolbar appears on the top of the table. Select the table icon, then the three dots ... on the right to adjust structure, add labels, apply colors, or write a caption.
Tip
For larger tables, choose Edit Table from the … menu to edit them in a separate editor instead of directly in the text.
More options are available inside the table. Click in the top row of the table and a drop-down arrow will appear to open another contextual menu. Add columns and rows, merge cells, sort, change the alignment, or delete a column.
Tables stay clean as you work. Formatting adapts automatically, even when pasting data from external sources.
Every table can become a chart. Just like for tables, click inside the table, then select the chart icon in the contextual toolbar (the icon in the middle).
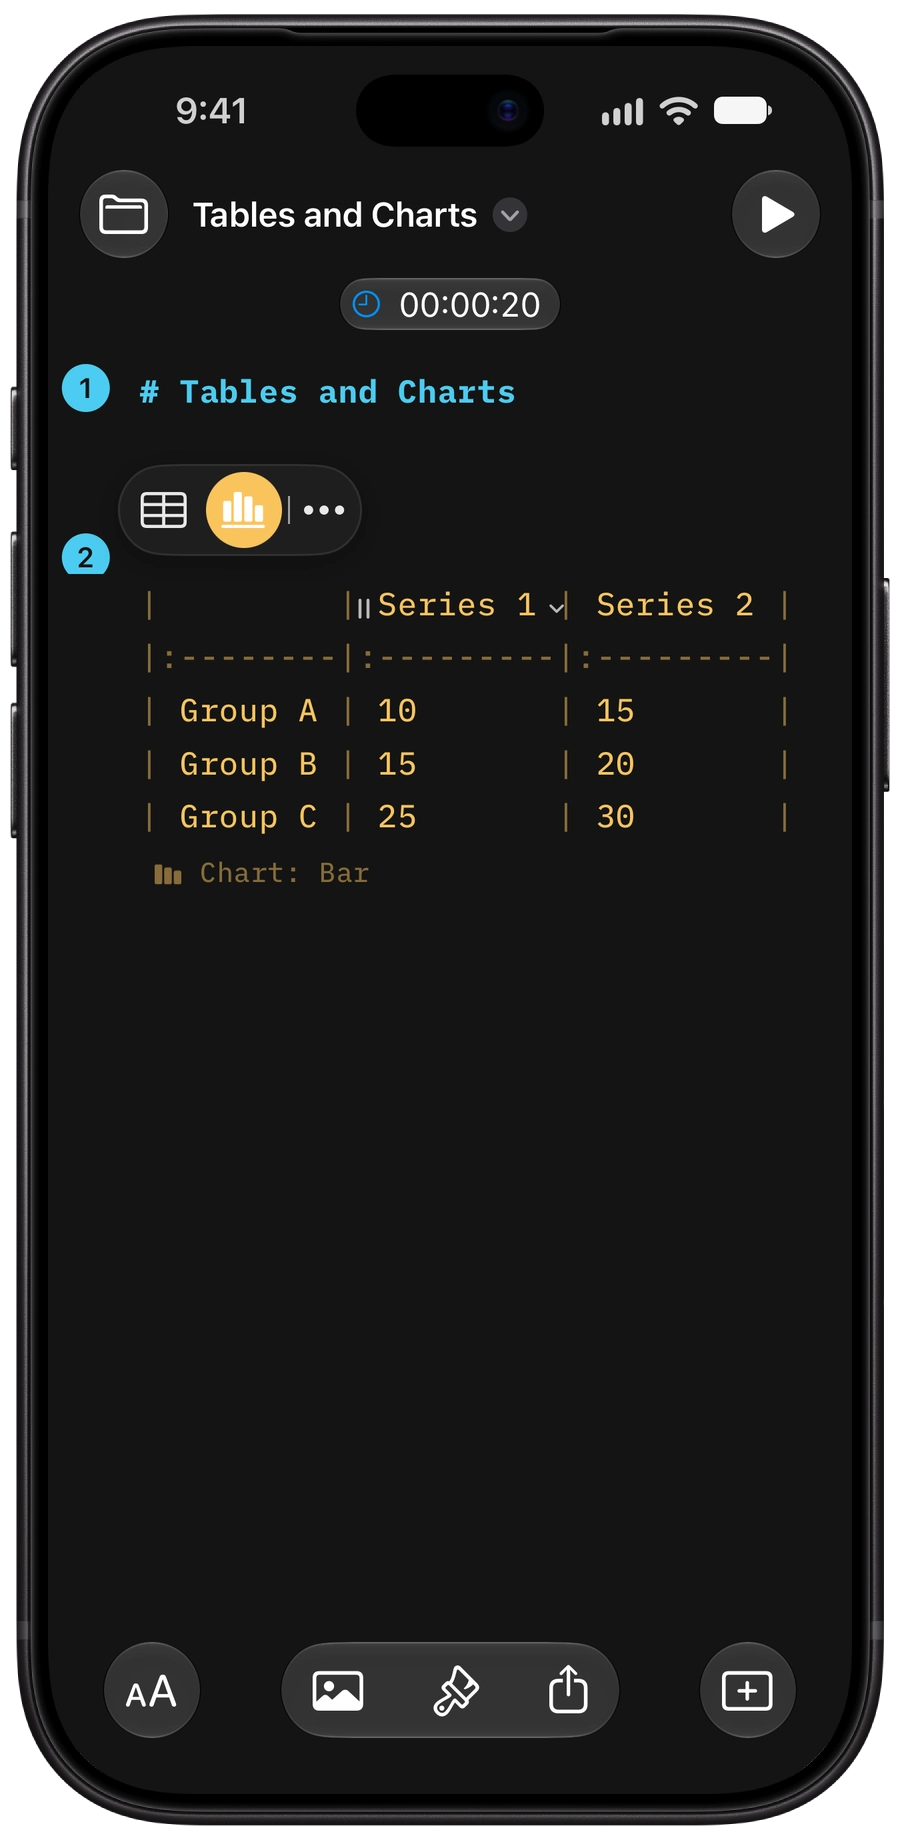
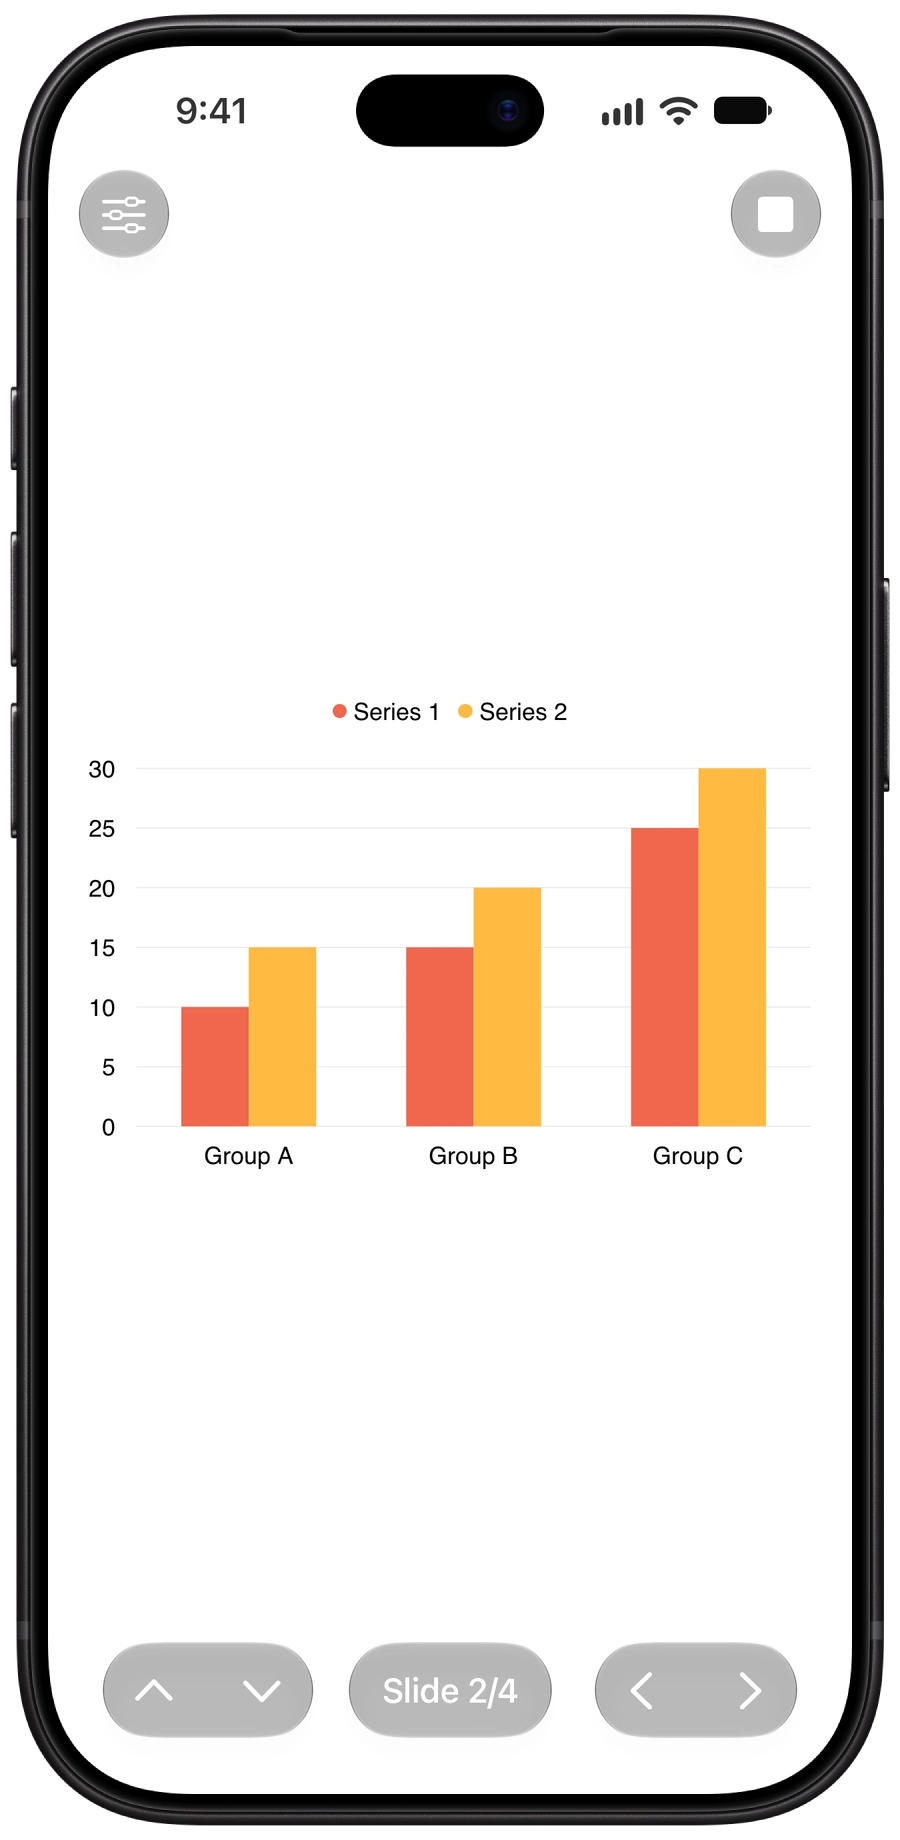
Use the three dots ... on the right side of the toolbar for more options. Click inside the header row to reveal the drop-down arrow with additional controls.
Charts work out of the box. The selection is intentionally limited: bar, line, and pie. Layouts adapt automatically. Colors are balanced and match your theme. No fine-tuning needed.
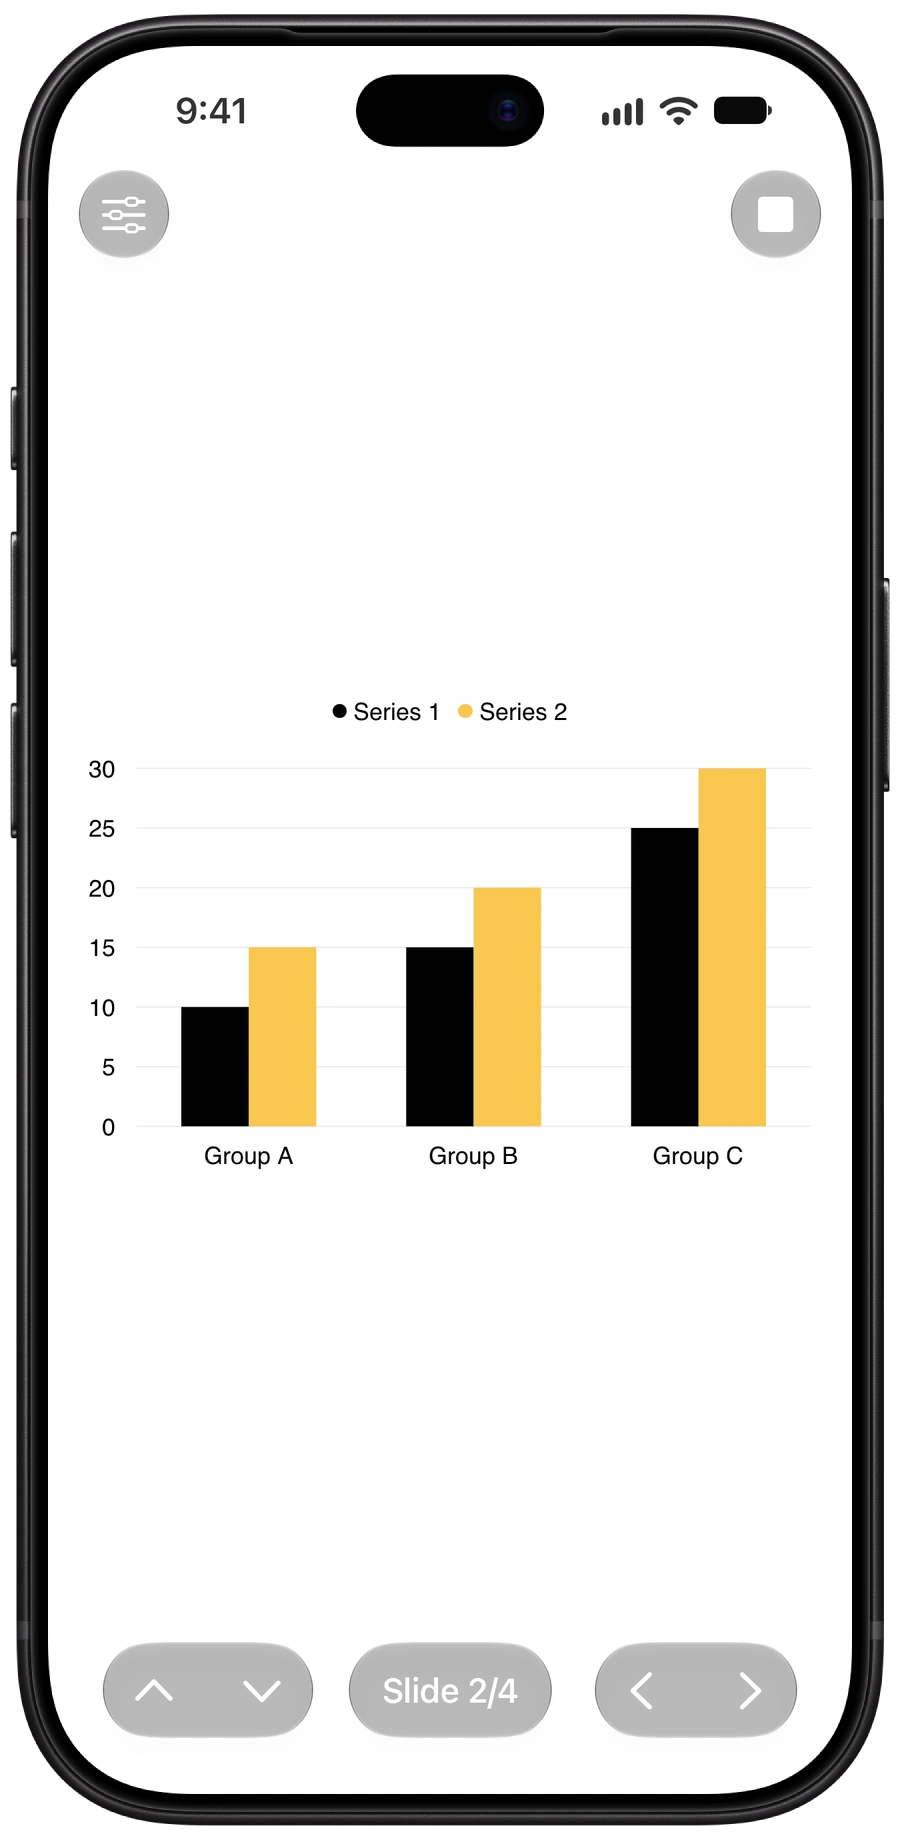
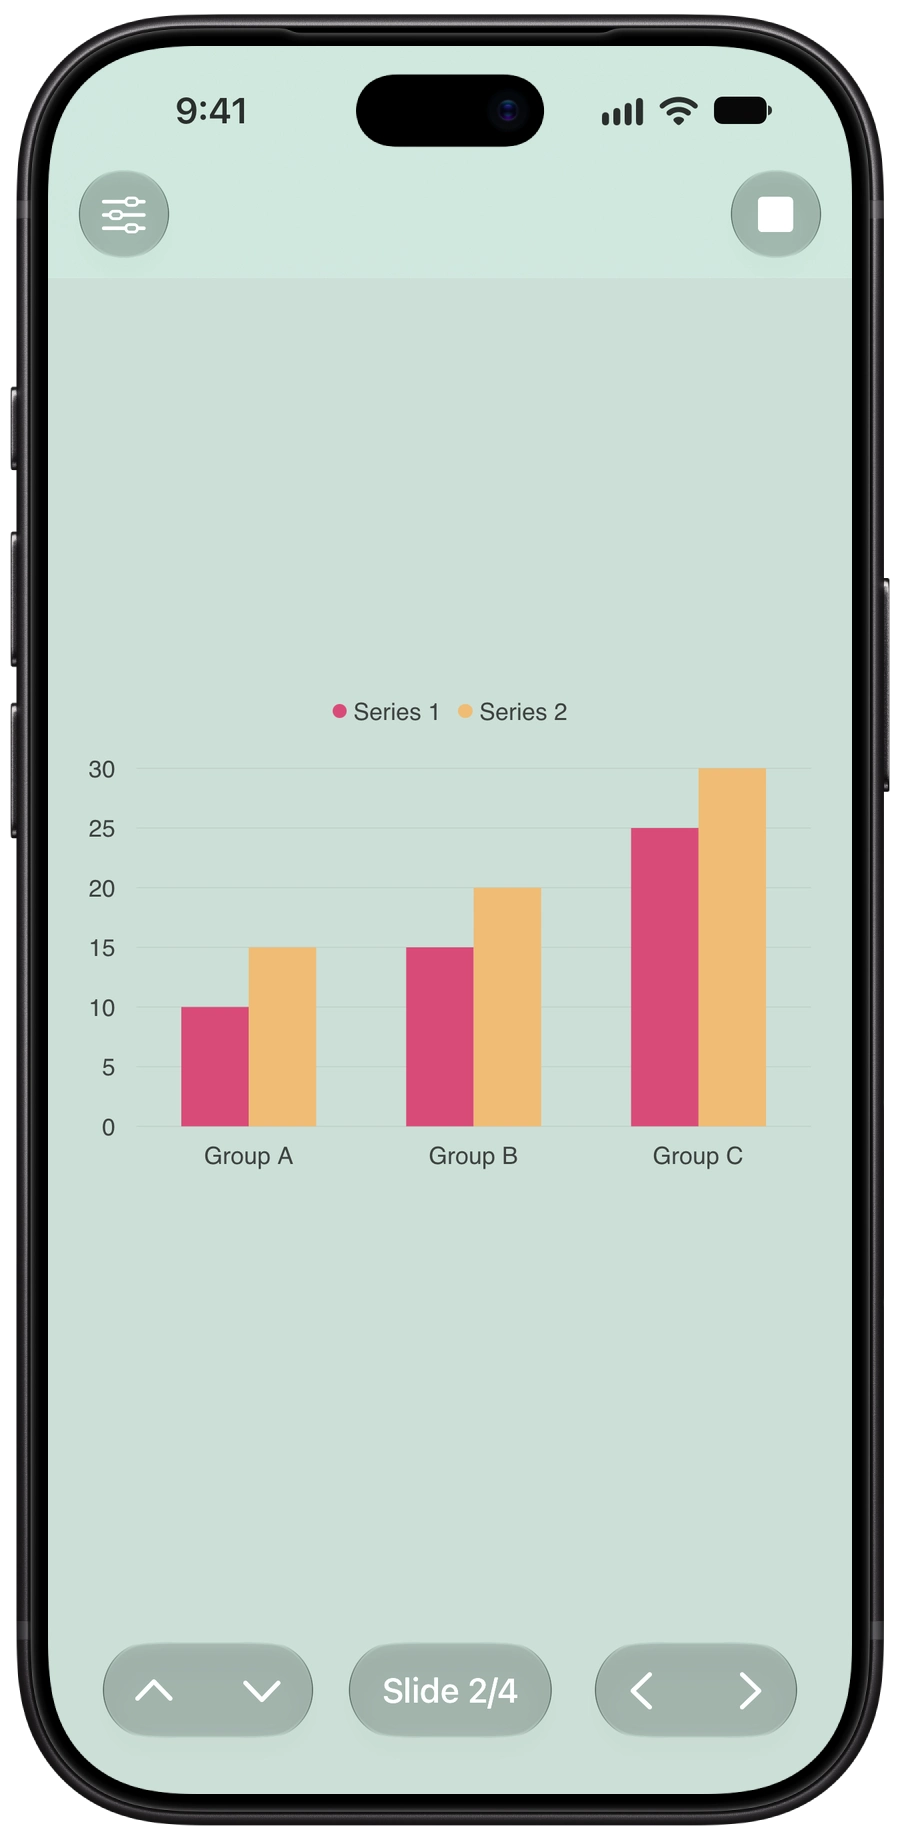
Just like with text and visual elements in slides, charts follow the good old rule: less is more. Keep your data simple, and reduce the number of charts to only what your audience truly needs to understand the story.